
DIY Telemetry: Streaming Live OBD2 Car Data to a Self-Hosted Grafana Dashboard

On this page(8 sections)
Introduction: Why Settle for a Speedometer?
Modern cars are essentially rolling networks of computers (ECUs) constantly chatting over a protocol called CAN bus. While your dashboard shows you the basics—speed, fuel, and perhaps a coolant temperature gauge that only moves when things are already catastrophic—there is a wealth of "under-the-hood" data you’re missing.
Imagine being able to see your exact intake air temperature, fuel trim adjustments, or turbo boost pressure in real-time, logged second-by-second on a professional-grade dashboard. Whether you’re a track enthusiast looking to shave seconds off your lap time or a DIY mechanic trying to diagnose a phantom misfire, building your own live telemetry system is the ultimate car-hacker project.
In this guide, we’ll build a telemetry gateway using a Raspberry Pi, bridge the vehicle data using Python, and visualize it all on a self-hosted Grafana dashboard.
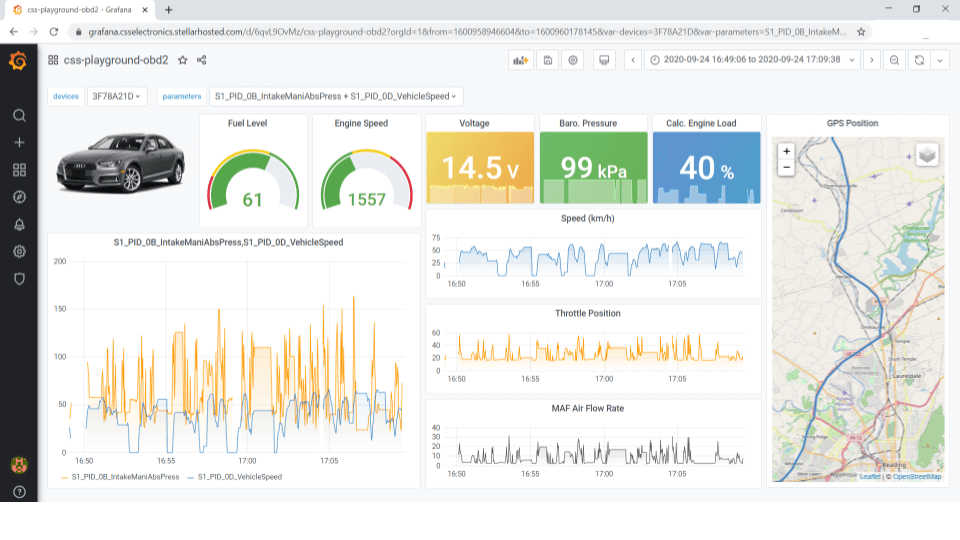
1. The Architecture: From Piston to Pixel
Before we turn a single wrench, let’s look at how the data flows. Your car’s OBD-II port is the gateway. We need a device to talk to that port, a script to translate the "raw" car language into something a database understands, and finally, a visualization layer.
The Stack
| Layer | Technology | Role |
|---|---|---|
| Source | Vehicle OBD-II Port | The raw data origin |
| Bridge | ELM327 Bluetooth or CAN Hat | Physical interface |
| Gateway | Raspberry Pi 4 | Data collector and processor |
| Ingress | Python Script | Translates OBD PIDs to Time-Series |
| Storage | InfluxDB | High-performance time-series database |
| Viz | Grafana | The "Control Room" dashboard |
2. Hardware Setup: Choosing Your Interface
You have two main paths to connect your Raspberry Pi to your car.
Option A: The Bluetooth ELM327 (Easiest)
Most modern cars and hobbyists use a Bluetooth OBD-II dongle. It’s "plug and play" but can suffer from lower refresh rates (3-5 updates per second).
Option B: The CAN Bus Hat (Advanced)
For high-speed telemetry (100+ updates per second), a dedicated CAN Bus Hat (like the Waveshare RS485 CAN Hat) is superior. It requires wiring into the car’s high-speed CAN network but provides "raw" access to every packet on the wire.
Comparison Table
| Feature | Bluetooth ELM327 | CAN Bus Hat |
|---|---|---|
| Cost | $15 - $30 | $25 + Wiring |
| Speed | Slow (Polling) | Fast (Interrupts) |
| Installation | Plug into Port | Hard-wired / Port |
| Difficulty | Beginner | Advanced |
| Protocol | Standard PIDs | Raw CAN Frames |
Pro Tip: For this tutorial, we will focus on the Bluetooth ELM327 method as it works with 99% of vehicles post-1996 without permanent modifications.
3. The Python Gateway: Talking to the ECU
We need a Python script to act as the middleman. We’ll use the python-obd library for the car side and the influxdb client for the database side.
The Ingress Script
import obd
import time
from influxdb import InfluxDBClient

# 1. Connect to InfluxDB
client = InfluxDBClient(host='your-server-ip', port=8086)
client.switch_database('car_telemetry')

# 2. Connect to Car
connection = obd.OBD() # auto-connects to USB or Bluetooth link

# 3. Define the metrics we want to track
pids = [
    obd.commands.RPM,
    obd.commands.SPEED,
    obd.commands.COOLANT_TEMP,
    obd.commands.INTAKE_TEMP,
    obd.commands.THROTTLE_POS,
    obd.commands.TIMING_ADVANCE
]

def push_to_influx(name, value):
    json_body = [
        {
            "measurement": name,
            "fields": {
                "value": float(value)
            }
        }
    ]
    client.write_points(json_body)

print("Starting Telemetry Stream...")

while True:
    if not connection.is_connected():
        print("Reconnecting...")
        connection = obd.OBD()
        time.sleep(5)
        continue

    for cmd in pids:
        response = connection.query(cmd)
        if not response.is_null():
            # Clean the value (strip units)
            val = str(response.value).split(' ')[0]
            push_to_influx(cmd.name, val)

    time.sleep(0.1) # 10Hz polling
4. Setting Up the "Data Center" (InfluxDB & Grafana)
If you don't already have a home server, you can run InfluxDB and Grafana directly on the Raspberry Pi using Docker.
Docker Compose Configuration
version: '3'
services:
  influxdb:
    image: influxdb:1.8
    ports:
      - "8086:8086"
    volumes:
      - influxdb-data:/var/lib/influxdb

  grafana:
    image: grafana/grafana:latest
    ports:
      - "3000:3000"
    depends_on:
      - influxdb
    volumes:
      - grafana-data:/var/lib/grafana

volumes:
  influxdb-data:
  grafana-data:
5. Designing the Dashboard
Now for the fun part: making it look like a race car's control room.
- Add Data Source: In Grafana, add InfluxDB. Use
http://influxdb:8086and databasecar_telemetry. - Create Panels:
- RPM Gauge: Use a "Gauge" panel. Query:
SELECT last("value") FROM "RPM". Set redline at 6500. - Temp Trends: Use a "Time series" panel. Plot
COOLANT_TEMPandINTAKE_TEMPtogether. - Throttle vs. Speed: A dual-axis graph showing how your speed responds to throttle input.
- RPM Gauge: Use a "Gauge" panel. Query:
Warning: Never interact with your Grafana dashboard while driving. Design it to be read at a glance, or better yet, review the data after your trip.
6. Understanding the Data: What to Look For
Once you have data, what does it tell you?
Common OBD-II PIDs and Their Significance
| PID Name | Units | What it reveals |
|---|---|---|
| Short Term Fuel Trim | % | Real-time adjustment to fuel mixture. Large (+/-) numbers indicate leaks or sensor issues. |
| Long Term Fuel Trim | % | Learned engine behavior. Ideal is +/- 5%. |
| Timing Advance | ° | How early the spark fires. High numbers = power; low numbers = heat or low octane. |
| Intake Air Temp | °C/F | Heat soak. If this is much higher than ambient, your air intake is inefficient. |
7. Conclusion: The Power of Knowledge
You’ve now turned your car from a black box into a transparent, data-driven machine. This setup isn’t just about the "cool factor"—it’s about longevity. By monitoring your fuel trims and temperatures, you can catch a vacuum leak or a failing thermostat weeks before a "Check Engine" light ever flickers on your dash.
Future Upgrades
- GPS Integration: Add a $15 GPS module to your Pi to correlate engine data with track position.
- Local Dashboard: Add a small HDMI screen in the car for a custom digital instrument cluster.
- Auto-Sync: Write a script to automatically upload your "trips" to the cloud when your car pulls into your home Wi-Fi range.
Happy hacking, and keep the rubber side down!
This is the second article in our "Smart Workshop & Car" series. Stay tuned for next week's guide on AI-powered garage security!

